


Dec 03, 2006
Automatic display of complex data in Second Life
Via 3D Point

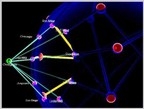
SL resident Turner Boehm has developed an application that allows to automatically model the links and nodes of a complex system using SL objects. The picture above shows multiple interconnecting software systems represented by an automatically generated set of prims, based on information stored outside SL.
13:13 Posted in Information visualization, Virtual worlds | Permalink | Comments (0) | Tags: virtual reality, information visualization
Nov 29, 2006
Moodjam mood visualization
Via Infoaesthetic

Moodjam is an online visualization of people's moods visualized as beautiful color strips. Users can keep a record of their moods every hour, day, and weeks and share them with friends, family or co-workers.
22:19 Posted in Emotional computing, Information visualization | Permalink | Comments (0) | Tags: information visualization, emotional computing
Nov 07, 2006
TagCrowd
From the TagCrowd blog
TagCrowd is a web application for visualizing word frequencies in any user-supplied text by creating what is popularly known as a tag cloud.
Today, tag clouds are primarily used for navigation and visualization on websites that employ user-generated metadata (tags) as a categorization scheme. (Flickr is a good example.)
TagCrowd is trying to do something different.
When we look at a tag cloud, we see not only a richly informative, beautiful image that communicates much in a single glance. We see a whole new approach to text.
Potential uses for tag clouds extend far outside the online realm: as topic summaries for written works, as name tags for conferences, as resumes in a single glance, as analyses for survey data, as visual poetry; the list goes on.
In the future, TagCrowd will develop into a suite of experimental tools and tutorials that empower social and collaborative uses for tag clouds and related visualizations.
00:28 Posted in Information visualization | Permalink | Comments (0) | Tags: information visualization
Nov 05, 2006
US Presidential Speeches Tag Cloud 1776-2006
Re-blogged from IFTF's future now
A very interesting way to see the changes in rhetoric over time (you can move the slider around to see trends in word usage)

The above tag cloud shows the popularity, frequency, and trends in the usages of words within speeches, official documents, declarations, and letters written by the Presidents of the US between 1776 - 2006 AD.
The dataset consists of over 360 documents downloaded from Encyclopedia Britannica and ThisNation.com.
22:15 Posted in Information visualization | Permalink | Comments (0) | Tags: information visualization
Oct 30, 2006
Flickr Graph
Flickr Graph is an award winning application (FITC awards 2005) developed by Marcos Weskamp that explores the social relationships inside flickr.com. It makes use of the classic attraction-repulsion algorithm for graphs.

Try Flickr Graph here
15:50 Posted in Information visualization, Social Media | Permalink | Comments (0) | Tags: social network analysis, information visualization, complex networks
Oct 26, 2006
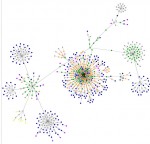
Social network vizster
Re-blogged from InfoAesthetics

Vizter is a sophisticated social network data visualization system that end-users of social networking services can use to facilitate discovery & increased awareness of their online community. vizster presents social networks using a simple network node-link representation, where nodes represent members of the system & links represent the articulated 'friendship' links between them. network members are depicted using both their self-provided name & a representative image. the networks are presented as 'egocentric' networks, consisting of an individual & their immediate friends. users can expand the display by selecting nodes to make visible others’ immediate friends as well. in addition, inferred community groupings of two or more nodes are visibly represented as 'blobs' surrounding community members, taking advantage of low spatial frequencies to make community structures apparent.
20:05 Posted in Information visualization, Social Media | Permalink | Comments (0) | Tags: social network data visualization system
Oct 11, 2006
Does "collective intelligence" exist?
Via KurzweilAI.net
Can people and computers be connected so that - collectively - they act more intelligently than any individuals, groups, or computers have ever done before?
Researchers at MIT Center for Collective Intelligence will address this question in a research project that will involve a group of thousands of people collectively writing a business book "Wikipedia style".
MIT researchers also expect to have projects on prediction markets, global climate change, and several other topics.
From the press release
“CCI is trying to look over the horizon to see what will be common five, 10, or 20 years from now. Google, Wikipedia, Linux, and e-Bay are examples that show something interesting and important is already happening. Such examples are not the end of the story, but just the beginning. And I hope that our work can help people understand and take advantage of these exciting possibilities"
MIT Center for Collective Intelligence: http://cci.mit.edu
“We Are Smarter Than Me” book project: http://www.wearesmarter.org
21:28 Posted in Information visualization | Permalink | Comments (0) | Tags: collective intelligence
Sep 08, 2006
Visualization of literature trends
Via infosthetics

CiteSpace is a network data visualization technique that facilitates the detection of emerging trends and transient patterns in scientific literature.
From Infoesthetics:
CiteSpace is based on 2 concepts: "research fronts", defined as an emergent grouping of concepts & underlying research issues & "intellectual base", the network of citations & co-citations of a research front in scientific literature. the size of a node is proportional to the normalized citation counts in the latest time interval. The label size of each node is proportional to citations of the article, thus larger nodes also have larger-sized labels. the user can enlarge font sizes at will, & both the width & the length of a link are proportional to the corresponding cocitation coefficient. the color of a link indicates the earliest appearance time of the link with reference to chosen thresholds. current applications show complex patterns regarding mass extinction research & terrorism research.
11:15 Posted in Information visualization, Research tools | Permalink | Comments (0) | Tags: information visualization
Aug 04, 2006
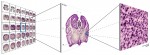
Whole-brain connectivity diagrams
Via BrainTechSci
In a previous post I covered BrainMaps, the interactive zoomable high-resolution diagram for whole-brain connectivity. Now the project provides a powerful new feature, the interactive visualization of brain connectivity in 3D.
From the download page:
Welcome to nodes3D, a 3D graph visualization program written by Issac Trotts in consultation with Shawn Mikula, in the labs of Edward G. Jones. On startup, nodes3d will download a graph of gross neuroanatomical connectivity from the MySQL database at brainmaps.org. Future versions will probably support loading of graphs from files or other databases
12:50 Posted in Information visualization, Research tools | Permalink | Comments (0) | Tags: neurotechnology
Aug 02, 2006
Urban Tapestries
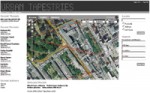
Urban Tapestries aims to enable people to become authors of the environment around them – Mass Observation for the 21st Century. Like the founders of Mass Observation in the 1930s, we are interested creating opportunities for an "anthropology of ourselves" – adopting and adapting new and emerging technologies for creating and sharing everyday knowledge and experience; building up organic, collective memories that trace and embellish different kinds of relationships across places, time and communities.
It is part of an ongoing research programme of experiments with local groups and communities called Social Tapestries.
10:23 Posted in Information visualization, Telepresence & virtual presence, Wearable & mobile | Permalink | Comments (0) | Tags: locative media
Aug 01, 2006
PTJ sitegraph
16:08 Posted in Information visualization | Permalink | Comments (0) | Tags: complex networks
Jul 25, 2006
Images that represent complexity
From KurzweilAI.net
Parsons School of Design teacher Manuel Lima has constructed striking images that represent complexity.

Read Original Article
22:13 Posted in Information visualization | Permalink | Comments (0)
Jul 19, 2006
Brain box
BBC News, july 17, 2006
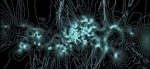
BBC reports that researchers from University of Manchester are developing a new biologically-inspired computer, which mimics the complex interactions between brain neurons.
The computer will be designed with the aim of modelling large numbers of neurons in real time and to track patterns of neural spikes as they occur in the brain. It will be built using large numbers of simple microprocessors designed to interact like the networks of neurons found in the brain. The aim will be to place dozens of microprocessors on single silicon chip reducing the cost and power consumption of the computer.
Read the original article
20:08 Posted in Information visualization, Neurotechnology & neuroinformatics, Research tools | Permalink | Comments (0)
Mar 26, 2006
CIO: Visualization of Internet Ownership


From CIO: What is this ball of colors? It is the North American Internet, or more specifically a map of just about every router on the North American backbone, (there are 134,855 of them for those who are counting). The colors represent who each router is registered to. Red is Verizon; blue AT&T; yellow Qwest; green is major backbone players like Level 3 and Sprint Nextel; black is the entire cable industry put together; and gray is everyone else, from small telecommunications companies to large international players who only have a small presence in the U.S. If you click on the map it will take you to much bigger version complete with labels that tell you the address of many of the routers
20:13 Posted in Information visualization | Permalink | Comments (0) | Tags: Positive Technology
Mar 16, 2006
A visual exploration on mapping complex networks
Posted by Luis on Networked Perfomance
VisualComplexity.com intends to be a unified resource space for anyone interested in the visualization of complex networks. The project's main goal is to leverage a critical understanding of different visualization methods, across a series of disciplines, as diverse as Biology, Social Networks or the World Wide Web.
18:18 Posted in Information visualization | Permalink | Comments (0) | Tags: Positive Technology
Mar 07, 2006
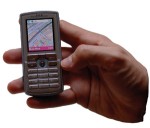
Near-Field Intrabody Communication
"As electronic devices become smaller, lower in power requirements, and less expensive, we have begun to adorn our bodies with personal information and communication appliances. Such devices include cellular phones, Personal Digital Assistants (PDAS), pocket video games, and pagers. Currently there is no method for these devices to share data. networking these devices can reduce functional i/o redundancies and allow new conveniences and services. The concept of Personal Area Networks (PANS) is presented to demonstrate how electronic devices on and near the human body can exchange digital information by capacitively coupling picoamp currents through the body. A low-frequency carrier (less than 1 megahertz) is used so no energy is propagated, minimizing remote eavesdropping and interference by neighboring pans. A prototype pan system allows users to exchange electronic business cards by shaking hands."
Personal Area Networks: Near-field intrabody communication by T. G. Zimmerman
20:55 Posted in Information visualization | Permalink | Comments (0) | Tags: Positive Technology
Jan 12, 2006
Small-World Human Brain Functional Network
A Resilient, Low-Frequency, Small-World Human Brain Functional Network with Highly Connected Association Cortical Hubs
J. Neurosci. 2006;
Small-world properties have been demonstrated for many complex networks. Here, we applied the discrete wavelet transform to functional magnetic resonance imaging (fMRI) time series, acquired from healthy volunteers in the resting state, to estimate frequency-dependent correlation matrices characterizing functional connectivity between 90 cortical and subcortical regions. After thresholding the wavelet correlation matrices to create undirected graphs of brain functional networks, we found a small-world topology of sparse connections most salient in the low-frequency interval 0.03–0.06 Hz. Global mean path length (2.49) was approximately equivalent to a comparable random network, whereas clustering (0.53) was two times greater; similar parameters have been reported for the network of anatomical connections in the macaque cortex. The human functional network was dominated by a neocortical core of highly connected hubs and had an exponentially truncated power law degree distribution. Hubs included recently evolved regions of the heteromodal association cortex, with long-distance connections to other regions, and more cliquishly connected regions of the unimodal association and primary cortices; paralimbic and limbic regions were topologically more peripheral. The network was more resilient to targeted attack on its hubs than a comparable scale-free network, but about equally resilient to random error. We conclude that correlated, low-frequency oscillations in human fMRI data have a small-world architecture that probably reflects underlying anatomical connectivity of the cortex. Because the major hubs of this network are critical for cognition, its slow dynamics could provide a physiological substrate for segregated and distributed information processing.
10:26 Posted in Information visualization | Permalink | Comments (0) | Tags: Positive Technology
Oct 20, 2005
Redrawing the US through individual perception
Via Wired
The CommonCensus Map Project is redrawing the map of the United States based on users' voting, to show how the country is organized culturally, as opposed to traditional political boundaries. It shows how the country is divided into 'spheres of influence' between different cities at the national, regional, and local levels.
The third national map has been produced, based on the first 16,000 votes
12:20 Posted in Information visualization | Permalink | Comments (0) | Tags: Positive Technology, complex networks
Sep 17, 2005
View of cell-phone activity in Graz
via Future Feeder
Digital Derive is a platform developed senseable city lab that allows to visualize the volume & geographic source of cell phone usage in Graz, showing a visual conceptual layer in the use & experience of the city.
 From the lab web site:
Digital Derive harnesses the potential of mobile phones as an affordable, ready-made and ubiquitous medium that allows the city to be sensed and displayed in real-time as a complex, pulsating entity. Because it is possible to simultaneously 'ping' the cell phones of thousands of users - thereby establishing their precise location in space at a given moment in time - these devices can be used as a highly dynamic tracking tool that describes how the city is used and transformed by its citizens. The polis is thus interpreted as a shifting entity formed by webs of human interactions in space-time, rather than simply as a fixed, physical environment. Digital Derive provides a platform upon which the contemporary city can register the flux and traces its self-constructing and open-ended nature. Previous initiatives, notably Laura Kurgan's 'You Are Here: Museu' (1996) and the Waag Society's 'Amsterdam Real-Time' (2002) initiated this process by exploring the qualities and potential of GPS technology. Digital Derive builds on an expands these efforts by using cell phone technology, for the first time, to radically increase the interactive capacity and number of users involved in the mapping of the city. Digital Derive (re)presents the city displayed simultaneously in the Kunsthaus Graz and in a publicly accessible website.
19:55 Posted in Information visualization | Permalink | Comments (0) | Tags: Positive Technology, complex networks
Sep 12, 2005
Social Networks as Health Feedback Displays
In this paper published on September/October issue of IEEE Pervasive Computing Journal Margaret E. Morris describes how social-networking and pervasive computing technologies can be used to help reduce feelings of social isolation and depression in elderly individuals.  In this approach, sensor data measuring phone calls and visits are used to derive public displays of social interactions with relatives and friends, which they introduced into select elders’ homes. According to Morris and colleagues, as people see their social interactions illustrated in these feedback displays, their feeling of social isolation is reduced.
Margaret E. Morris. "Social Networks as Health Feedback Displays," IEEE Pervasive Computing Journal, vol. 9, no. 5, pp. 29-37, September/October 2005.
Abstract
Social networks have thus far served primarily as analytic tools for social scientists. Leveraging pervasive computing, this new research transforms social-network models into behavioral feedback displays. These ambient displays, which reflect data on remote and face-to-face interaction gathered by wireless sensor networks, were intended to raise awareness of social connectedness as a dynamic and controllable aspect of well-being. An interdisciplinary health technology research group at Intel recently developed and tested prototypes in the homes of older adults and their caregivers. This article reviews the psychological rationale for the project and highlights some reactions of participants to the displays.
15:20 Posted in Information visualization | Permalink | Comments (0) | Tags: Positive Technology, complex networks